Introduction
·
Define what sampling means, with a strong
focus/emphasis on what it means to sample in a spatial perspective.
o
Sample can be defined as part or single item
that is representative of a larger group. Spatially a sampling method needs to
be able to allow for enough data to create a stronger representation of the
area or object that is being sampled.
·
List out the various sampling techniques
o
Simple Random Sampling (SRS)
o
Stratified Sampling
o
Cluster Sampling
o
Systematic Sampling
o
Multistage Sampling (in which some of the
methods above are combined in stages)
o
Multiphase Sampling
o
Convenience Sample
o
Purposive Sample
·
What is the lab objective(s)
o
The objective of this lab is to use geospatial
thinking to construct an elevation surface of a terrain that is located in a
square meter sandbox. The profile had to include a ridge, hill, depression,
valley, and a plain (Figure 1). Finally, the group will be able to map out the elevated
surface using original survey technique.

Figure 1. Photo of an top view of what the profile our group created with all the requirements.
Methods
·
What is the sampling technique you chose to use?
Why? What other methods is this similar to and why did you not use them?
o
We used systematic sampling so we could create a
method that allows for the most data points that will target the majority of
the grid.
·
List out the location of your sample plot. Be as
specific as possible going from general to specific.
o
The sandbox was located on the University’s
campus.
o
It was to the East of Phillips Hall, across the
road of Roosevelt Ave.
o
About 100 ft. from the loading dock of Phillips
to the sandbox located next to a shed.
·
What are the materials you are using?
o
Materials that were used were a meter stick,
string and tacks, a flag, and a square meter sandbox.
·
How did you set up your sampling scheme?
Spacing?
o
For this lab, our group chose to create a grid
that allowed for 20 points on the X-axis and 20 points on the Y-axis as shown in Figure 2.
o
The grid consisted of 400 squares, where we
measured a point in the top-right corner to achieve our 400 data samples.

Figure 2. Grid of our profile with x and y-axis defined.
· How did you address your zero elevation (sea level)?
o
We measured the height of the sandbox to get a
defined sea level of 15 cm.
·
How was the data entered/recorded? Why did you
choose this data entry method?
o
We created a 3 column table with X-Y-Z as the
headers for each column. The x-axis and the y-axis was defined in the row,
before the elevation of Z was recorded. The group then took the difference between the string and where the sand ends in order to figure out the elevation or Z (Figure 3).
o
With only a notebook as a form of recording data,
creating columns was the most efficient way of entering data before it was
entered on a spreadsheet into a table.

Figure 3. Meter stick measuring at one of our sample points by measuring the space between the sand and the string.
Results/Discussion
·
What was the resulting number of sample points
you recorded?
o
400 sample points
·
Discuss the sample values? What was the minimum
value, the maximum, the mean, standard deviation, etc.
o
The range of the sample points was 14, with the minimum
value being 7 cm and the maximum value being 21 cm (Figure 4).
o
The mean was 12.48 cm, with a standard deviation
of 2.14 cm.
o
The mode was 12.
o
Our sea level was also established at 15 cm.

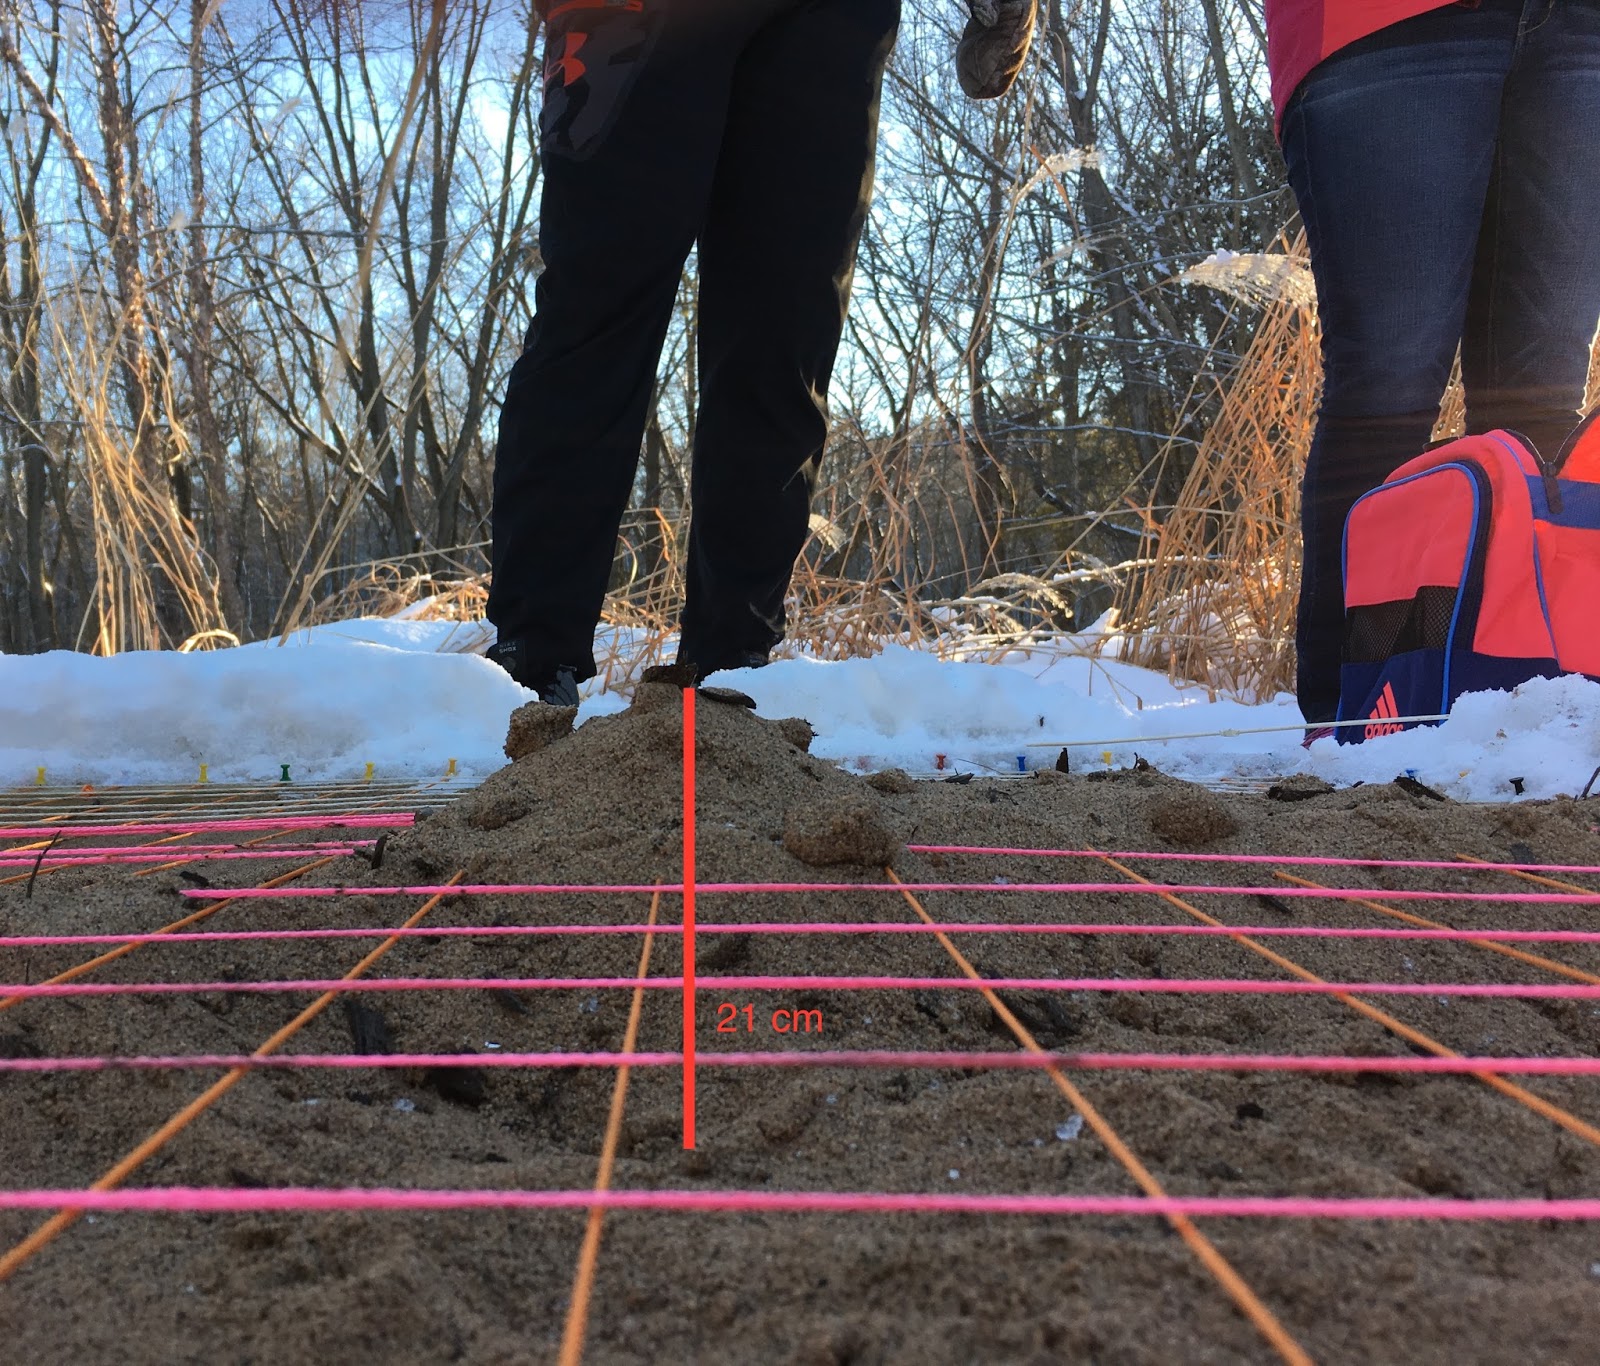
Figure 4. Photo of our hill and maximum Z-value.
·
Did the sampling relate to the method you chose,
or could have another method met your objective better?
o
For this particular activity, we could not have
used any of the random samples. Therefore, systematic was the best choice.
·
Did your sampling technique change over the
survey, or did your group stick to the original plan? How does this relate to
your resulting data set?
·
What problems were encountered during the
sampling, and how were those problems overcome.
o
During the sampling, often times the spot that
we were going to sample next was often lost. But we were able to follow along
with the grid system of our data collection in the notes.
o
There were often times that the meter stick was
to big more measuring elevation and some of the data points may not be as
accurate as they should.
Conclusion
·
How does your sampling relate to the definition
of sampling and the sampling methods out there?
o
While often times, there needs to be a random
sample in order for much of the data collection to be considered unbiased and
representative of the larger sample. In this case in order to gather enough
data to accurately represent the elevations of different points in our sandbox,
the sampling method needed to be systematic.
·
Why use sampling in spatial situation?
o
Sampling eliminates the bias and persuasion of
how one would collect the data.
·
How does this activity relate to sampling
spatial data over larger areas?
o
By using this small scale model of the sandbox,
we could conduct another sample of a larger area with the same grid technique
as well as use the sampling method we chose for this exercise for a larger area
as well.
·
Using the numbers, you gathered, did your survey
perform an adequate job of sampling the area you were tasked to sample? How
might you refine your survey to accommodate the sampling density desired.
o
It is already noticeable in that sample shows
variation in the landscape based on the higher numbers in some areas, lower in
other, and a consistency of numbers in the depression. To refine the measuring
aspect of the survey, I would find a more efficient and accurate use of
measuring. The metering stick may not have been the best way to get accurate
measurements of the elevation.
No comments:
Post a Comment