Introduction
Pix4D is a photogrammetry software that uses images to generate point clouds, digital surface and terrain models, orthomosaics, textured models, etc. It can generate 2D and 3D information strictly from images. This software is for professional drone-based mapping. In this lab, the Pix4D software will be used to assess the areal images from the drone, Phantom 3, of the Litchfield Mine. The images will be provided and the data collection was not done by the class itself. By using the software, the understanding of image quality will be strengthened for future uses with Pix4D and drone use.
Methods
Before starting the project, a series of images needed to be created that overlap in order to process the imagery. The overlaps depends on the type of terrain that is mapped. This also determines the rate at which the images have to be taken. The recommended overlap is at least 75% frontal overlap and 60% side overlap, shown in Figure 1. The camera should be maintained at a constant height over the terrain as much as possible to ensure the desired GSD.
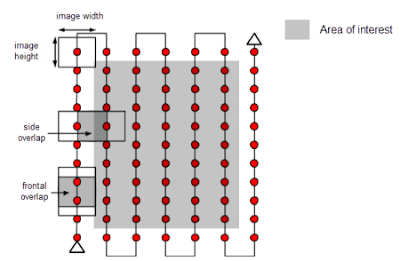 |
| Figure 1: Ideal Image Acquisition Plan. |
For particular terrains persuasions need to be taken. For example, snow and sand have little visual content due to large uniform areas. At least 85% frontal overlap and a minimum of 70% side overlap.
Rapid checks of the resolution can be done. However, it reduces the resolution of the original images. It, then, lowers the accuracy and may lead to incomplete results. Fewer keypoints are extracted on each image and which makes the amount of matched points between the images lower. If the rapid check processing succeeds, it is safe to assume that the results of full processing will be of high quality. However, if it fails, it means that the dataset is difficult and requires more overlap. It would be a good idea to collect more images if this happens. This can be done by either flying the drone again and combining projects or changing the plan to get more overlap. Since Pix4D can process multiple flights, it allows for multiple cameras as well. It matches the images from one flight with the ones from other flight using the time information when having multiple flights without geolocation using the same flight plan over the same area, and having different camera models for each flight. Oblique images can also be take to process the terrain imagery. Figure 2 show how images are taken with a camera axis not perpendicular to the ground.
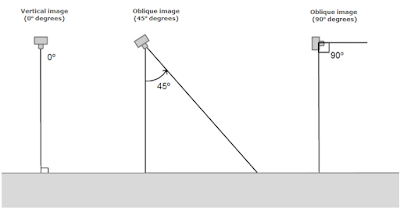 |
| Figure 2: Oblique image angles for drone image capturing. |
It also highly recommended to have Ground Control Points (GCP). They are points of known coordinates in the are of interest. These coordinates are measured with traditional surveying methods or other sources like LiDAR. GCP's are the absolute accuracy of the project. This allows for the project to be located in the exact points of the earth. A minimum of 3 GCPs is required for the reconstuction process linked to at least 2 images, 5 to 10 for large projects. They should also be placed evenly on the landscape to eliminate some of the error in scale and orientation. The are also more resourceful if they are not at the edges of the images but in the middle, because then the points can be used in multiple images.
Once the images are created, the Pix4D software can create projects to combine the images. The following steps can be taken to create a map of the terrain.
- Create and name a new project. The name should include the data, site, platform/sensor, and altitude.
- Add the images to the project. At least 3 images in JPG or TIFF are required. Once the images are added, Pix4D looks at the exif file and notes if the images are geotagged and finds the coordinate system. Most UAS data defaults to WGS 84 decimal degrees.
- In the Edit Camera Model, select edit un ther Camera Model name and change its properties to Linear Rolling Shutter.
- Process only the first step. After the first step is processed a quality report will appear. The quality report will provide information on the quality of the data accuracy and collection.
- If the problems in Step 1 are addressed, continue full processing Steps 2 and 3. Another quality report will appear.
Discussion
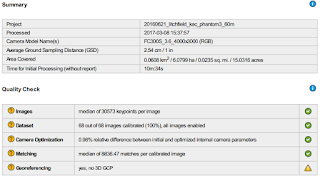
The quality report for the completed processing includes a summary (Figure 3). Under quality check, it shows that 68 out of 68 images were calibrated and enabled. Therefore, none of the images were rejected.
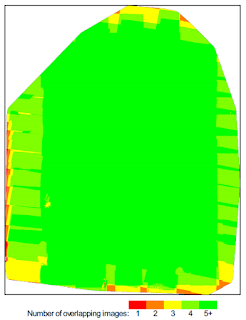
The overlap for this activity included 5 images of overlap (Figure 4). The overlap areas that were poor are located on the edges of the image. This could be due to less GCP points or more images in the middle of the field of interest. In the quality check, the georeferencing posed some error/issue in the final report after processing. This is due to the lack of 3D GCP. There was still GCPs provided for the lab.
Figure 5 is a mosaic image of the elevation results that were detected from the calibration images and geolocated images. This includes a preview of what was included in the summary and quality check details.
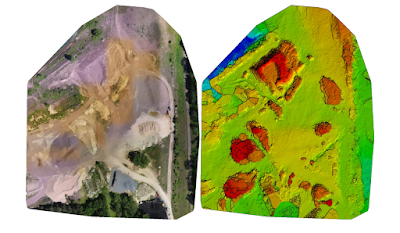 |
| Figure 5: Orthomosaic and the corresponding sparse Digital Surface Model (DSM) before densification. |
 |
| Figure 6: Fly video of the project terrain. |
Once the final terrain was created from the combining of all the drone imagery, in ArcMap, the raster image was implaced to show the area of interest in the Litchfield Mine (Figure 7). Using the Phantom 3 Drone, an elevation of 60 meters was obtained above the study area.
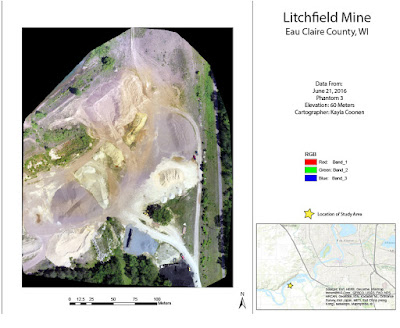 |
| Figure 7: Final product of the data created in Pix4D. |
Conclusion
By using Pix4D, another understanding of how to create areal imagery was obtained. In the future, hopefully more feature classes can be created using ArcGIS to further describe the study area. Pix4D allowed for a better understanding of the accuracy of the data. By having the quality report available, it can be shown which areas contain error. Like previously stated, this lab showed error in the Georeferencing. The data of this lab was created from another source, therefor, the error in the GCP was not something that could be controlled. However, it still served as a great example of what issues could arise when the areal images with the drones are collected by the class. By running through the tutorial of how to use Pix4D, it provided information of how to perfect/improve the data collection and what is expected when the chance to survey comes along.
No comments:
Post a Comment