The purpose of this lab was to create a grid based coordinate system. While this method is not the ideal way to collect points, the tools and techniques learned in this lab prepare us for times in the field when certain technology fails.This sampling method relates to other methods including the point-quarter method and mapping out linear features on the landscape. The survey will use distance and azimuth. Azimuth is the direction of an object from a particular point, expressed by angular distance. Three different stations were selected. Standing in one central location, different distances of trees, diameters, and azimuths were surveyed.
Study Area
For this lab, the class was divided into three groups and headed to Putnam Drive/Park on the UW-Eau Claire Campus. This specific area includes a dirt path that goes through a wooded area. As seen in Figure 1, the green path represents the dirt path that is Putnam Drive. The north side of the path is a floodplain that also has a creek flowing through it. It contain many trees in the saturated ground. The south side of the trail has a large gradient slope that also contains many trees.
 |
| Figure 1. Putnam Drive/Park Study area in relation to the three stations located on UW-Eau Claire's campus. |
Methods:
After selecting the central point to record data, the Latitude and Longitude coordinates were recorded using the Bad Elf GNSS Surveyor (Figure 2). These coordinates were later converted to decimal degrees for data normalization purposes. From this point of origin, 10 different trees were selected.
 |
| Figure 2. Bad Elf GNSS Surveyor used for detecting Lat and Long coordinates. |
 |
| Figure 3. Image on the left: TruPulse, Middle Image: Sonin Combo Pro, Right Image: colleague using a tape measure to measure the distance from the point of origin to the tree. |
 |
| Figure 4. Suunto used as a way to calculate Azimuth to detect the degree to which the tree is located from the point of origin. |
 |
| Figure 5. Colleagues and I recording, measuring, and detecting the azimuth. |
Using the recorded data from Table 1 in ArcMap, the data needed to be altered. Using the tool in the ArcToolbox Bearing Distance to Line, the distance from the point of origin to to the selected tree was shown. To create points from the trees the tool Feature Vertices to Point created the points of the trees at each station as well as the point of origin, Shown in Figure ?.
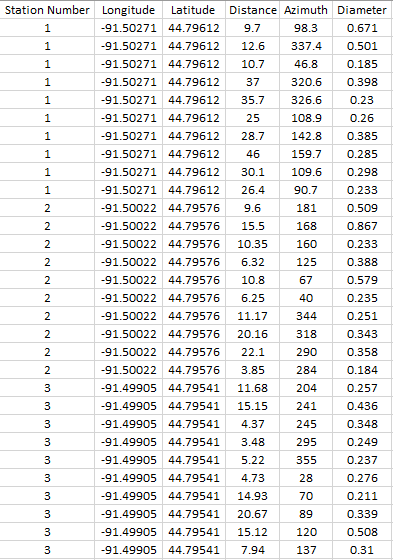 |
| Table 1. Complete results of the recorded data surveyed at the three stations. |
After the tools were used to created the two feature classes in the geodatabase, results like the ones in Figure 6 were created.
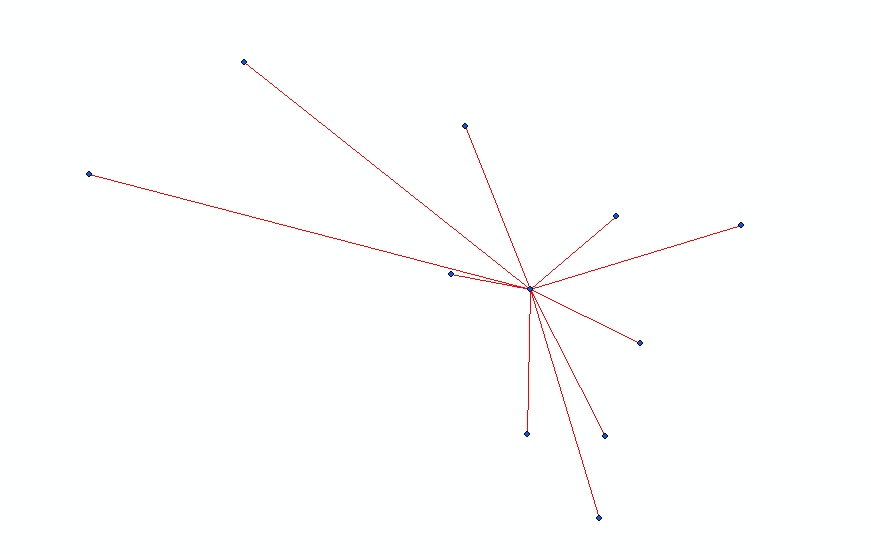 |
| Figure 6. Bearing Lines and Points created using the tools in ArcGIS to conduct and azimuth survey. |
Results:
By overlaying the points on a basemap (Figure 7), it appeared that there was some variation in the stations. Stations 2 and 3 seem relatively accurate because the points are off the path of Putnam Drive, considering the points of origin were off the path as well. The first station raises question due to the fact it seems a tree point is on top of the hill. But that could also be due to the fact that elevation is not shown in this figure. There is a path that crosses over Putnam Drive where the first station on the left was recorded. There must have been error in the coordinates because the azimuth for station one is farther to the left than it should be.
After joining the points to the table, the diameter could be shown using graduated symbols. By looking at the diameters, it showed the variation of the sizes in the trees that were surveyed. The goal was to find accessible trees that were larger in diameter. |
| Figure 7. Azimuth map of the trees surveryed in Putnam Park. |
 |
| Figure 8. A map demonstrating only the variations in diameters among the trees that were surveyed. |
Conclusions:
The grid based coordinate system is a great technique to learn when technology fails or a back up plan is needed like when a GPS is not available. However, this method is not the most practical way to collect points. That was shown in one of the stations that was not located in the correct spot, showing that the accuracy of the data was off. Knowing the exact point of origin and it's coordinates is key to using the distance azimuth survey method.
No comments:
Post a Comment