Using Survey 123 for ArcGIS, a survey can be created. In this particular tutorial a survey was made to help the homeowner association (HOA) gather data on the community members' and thier preparedness for disasters. Using this site, start by clicking on Create New Survey. Aftering titling and adding details to the survey, then the questions can start. The Add tab allows for common questions to be asked such as the date, single line text, multiple choice questions, and more shown in Figure 1.
 |
| Figure 1. Options of possible ways to ask questions in while creating a New Survey. |
The single choice allows for options with only one being able to be chosen. Multiple choice acts as a check box, selecting all that apply. Some questions can only be asked if circumstances are set. For example, if yes is selected, then another question can ask such as how many. Nine safety check questions (Figure 2) were created in the survey along with other information about the households.
 |
| Figure 2. A few of the Safety Check Question asked on the survey. |
A geodata box was also implemented to show the exact spot of the location that was identified. This geodata can then later be used to map the locations of community members that completed the survey and the area that their house is located. When questions are completed and looked over for their correctness, the survey can be published. This survey then can be used on computers, tablets, and phones. The survey will also adjust based on the device used to make it more user friendly.
Complete and Submit the Survey
Download the Survey123 field app. It can be retrieved from iTunes App Store, Google Play, and Windows Store. Once the app is opened and the person is signed in, select the designated survey (HOA Emergency Preparedness Survey). After choosing Collect, the survey can begin. The survey asks for the date, participant location, and asks to locate the residence on the map as well (Figure 3).
 |
| Figure 3. A screenshot on the phone app of the first questions asked on the survey, specifically the location ones. |
 |
| Figure 4. A screenshot of the survey on the phone app using a multiple choice question. |
 |
| Figure 5. A screenshot of the survey on the phone app showing an example of a question that had a follow up question after selecting yes. |
Once members complete the survey, it is saved to see who competed it. Under the MySurvey's tab, the Collaborate and Analyze sections can be used to look over who completed the survey. This is also where it can be decided who gets to see the survey.
Analyze Survey Data
After members have completed the survey, the data can be looked at in a variety of ways. Returning to the website, the Overview will show how many records and participants there are and the data of submission. The Analyze tab has the statistics of each question and how each participant answered them (Figure 6).
 |
| Figure 6. A pie chart of the response for the question "What Type of residence do you live in?". |
 |
| Figure 7. the Heat Map in the ArcGIS Map Viewer online. |
Share your Survey Data
The Online ArcGIS Map Viewer can be used as an interactive map that allows for the data to show for each location. If a certain point is selected the shareable data will pop up in a window next to it. It will show the answers how the participate answered in that location (Figure 8).
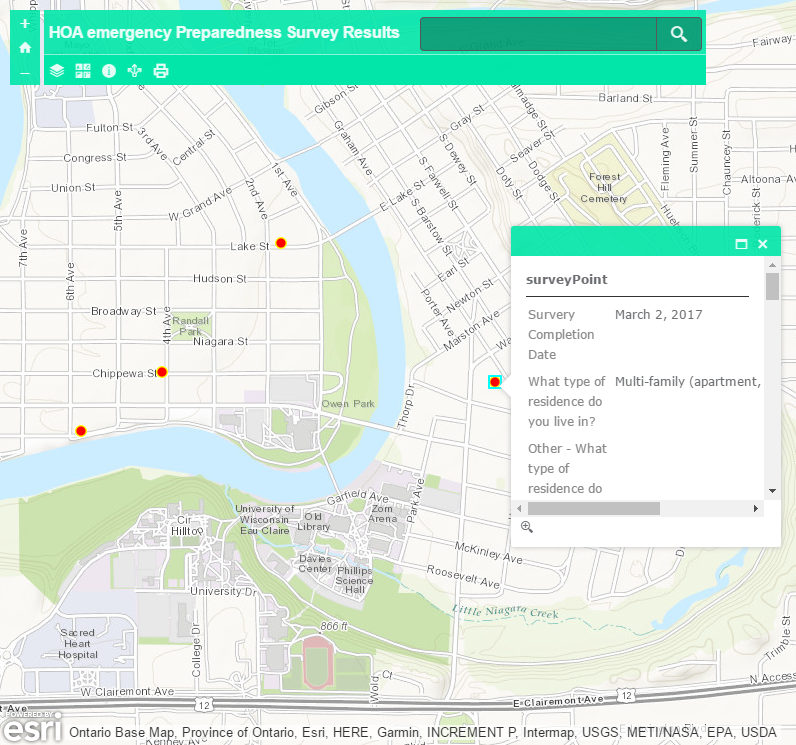 |
| Figure 8. The interactive location in response to submitted surveys and the data that is available if a point is selected. |
No comments:
Post a Comment